A (almost) free observability platform ? Part 2
This article is part of a simple case study about the integration of DecaLog with other open source software:
-
-
-
- Part 1 - Events & Traces
- Part 2 - Metrics
- Part 3 - KPIs & Dashboards / Jan. 2022
-
-
Now that we know how to collect and send events and traces from WordPress to Loki and Tempo – either self-hosted or taking advantage of the Grafana Cloud service – we will see how to send metrics collated by DecaLog, still using open source softwares and keeping the costs of the solution as low as possible.
Nevertheless, if we have previously kept a unity in the softwares used between the two approaches, it will not be the case this time. Indeed, Grafana Cloud does not allow all the flexibility in the choice of tools and communication modes and protocols while in a self-hosted environment, the best solutions are within our reach.
Collecting metrics in your own environment
The best choice for metrics self-hosting is to use a time series database. We will use here InfluxDB, the free and open source database from InfluxData. Once again, installing it in your own environment will be remarkably simple: InfluxData offers a fully dockerized InfluxDB 2 version that you can install on any available VM in your environment.
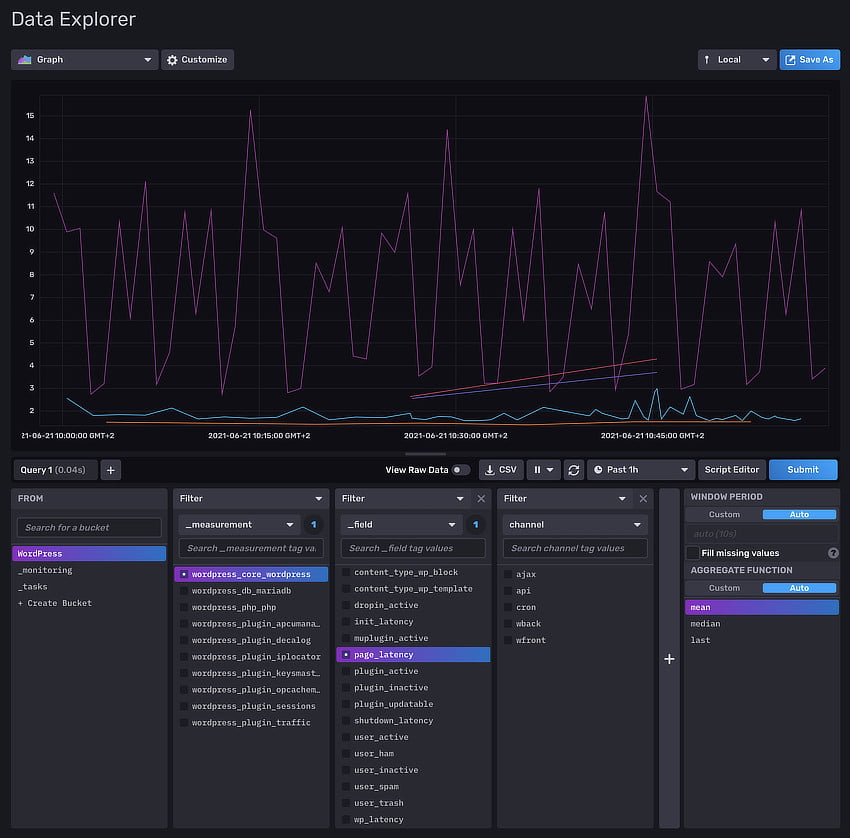
Once installed and operational, add a “InfluxDB 2” logger in DecaLog. You can now observe metrics right in InfluxDB web interface:
If you want to access your metrics in the same manner as your events and traces, add the InfluxDB instance as available source in your Grafana instance (Settings > Data Sources > Add A Datasource). Note, to do that, you will need to create a “read/write” token in InfluxDB (Data > Tokens > Generate Token) to allow Grafana to query InfluxDB data.
Collecting metrics with cloud-based service
When you created your Grafana Cloud account, a Prometheus instance was automatically created and associated with your account. So you just have to send your metrics to this service. Unfortunately, this cannot be done directly! Indeed, you will have to go via a “gateway”. There are many solutions to use as gateway, but I strongly suggest you to do it via a Grafana agent. This agent maybe installed everywhere, even on your own workstation – provided is is always on. It will scrape the metrics of your WordPress site and write them to your Grafana Cloud Prometheus instance.
Once this agent installed, and before adjusting its settings, create a “Prometheus Endpoint” logger in DecaLog. Then, click on “view” action below the logger’s name and copy the resulting url:
Now, you can specify this url as scrapping endpoint in the agent settings and add the information given by Grafana Cloud. Basically, the agent configuration file will look to something like this:
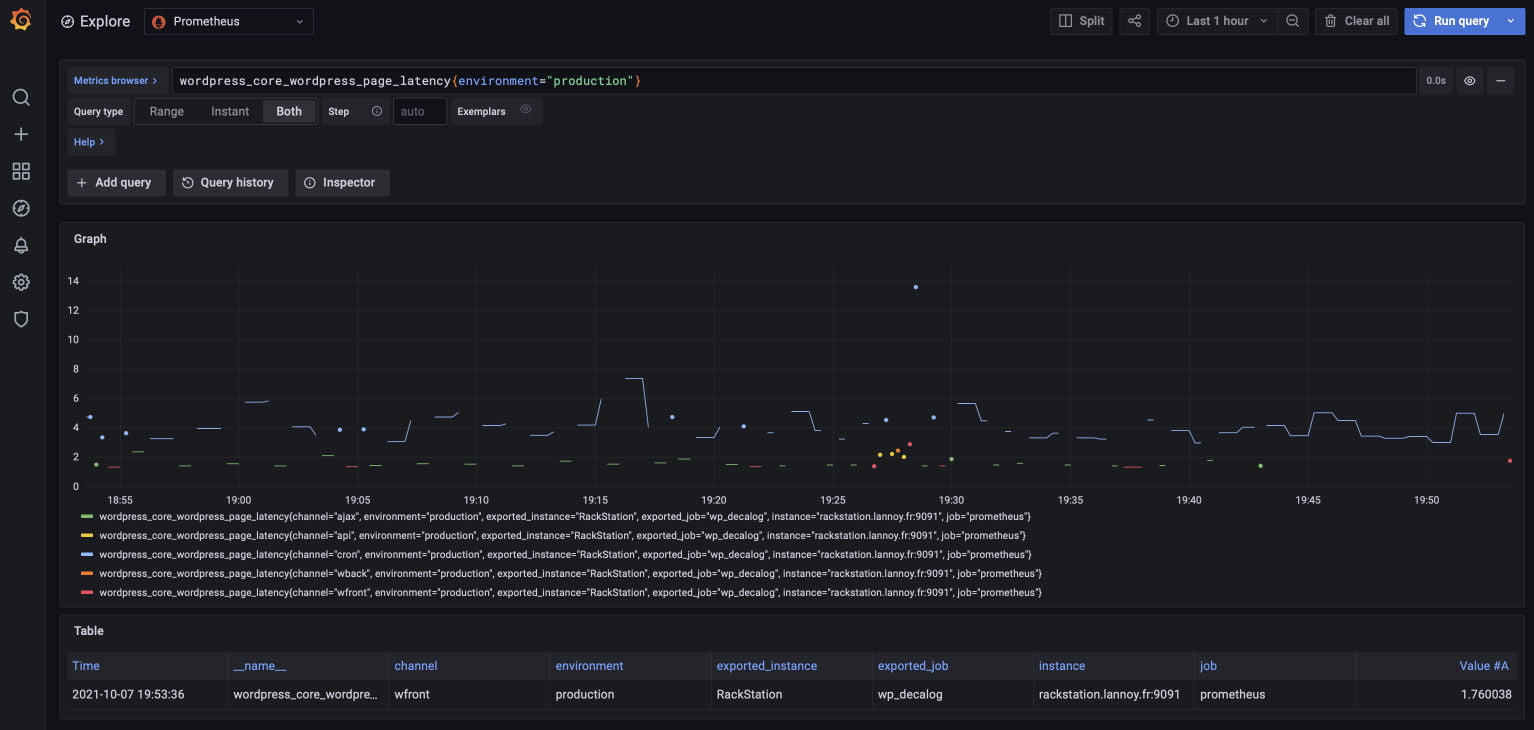
Once operational, you can access your metrics right in the web interface of Grafana:
Thanks to Grafana and Prometheus or InfluxDB, you’re now able to access all your WordPress metrics. Let’s see now how to efficiently process and visualize the data collected by DecaLog (coming soon).
If you have question about WordPress observability with DecaLog, you can reach me on Twitter.


