A (almost) free observability platform – Part 1
I know many of you are wondering: “How do I know if DecaLog is suitable for my usages?”, “How can I simply test all the features of DecaLog?”, “How to get started in a simple and affordable way?”, etc.
Well, the easiest answer is obviously to use the visualization tools built right in DecaLog. They are operational, easy to use and efficient. But they do not cover the whole spectrum, are not necessarily adapted when you manage several sites and you may want to “outsource” the visualization and analysis of logs and KPIs?
So, to help you test, manipulate and understand all the benefits of making WordPress observable, I suggest here two simple solutions to interface DecaLog with high-end products? at almost no cost!
This article is part of a simple case study about the integration of DecaLog with other open source software:
-
-
-
- Part 1 - Events & Traces
- Part 2 - Metrics
- Part 3 - KPIs & Dashboards / Jan. 2022
-
-
In the first part of this three-part series, we will look at how to build a complete events and traces management solution around Grafana!
Grafana is a multi-platform open source analytics and interactive visualization web application that provides charts, graphs, and alerts for, in the present case, analyzing, visualizing and manipulating the events, traces and metrics generated by WordPress and collected by DecaLog.
As Grafana is an open source solution developed by a company, you have two choices to use it: run it in your own environment or use the cloud-based service
Using the cloud-based service
This version of Grafana (the product) is operated by Grafana Labs (the company) and, of course, is a paid service. This service, named Grafana Cloud, comes with many pricing plans including a free-tiers. This free-tiers is a low-volume, short-retention plan but it will allow you to fully use DecaLog for a limited number of sites (2 or 3 sites, not much more) in a fairly efficient manner.
Running Grafana on your own environment
If you prefer to stay in control of your data and you have idle VM(s) lying around – who doesn’t? – the best approach is to install Grafana on your infrastructures. You can do this in a number of ways, but the fastest and hassle-free way is to do it via Docker.
Collecting events and traces
Now that you have a Grafana Cloud account, or that you have installed Grafana in your own environment, you will have to store the events and traces generated by DecaLog so that you can view them with Grafana.
This is done with two products developed by Grafana Labs: Loki for events and Tempo for traces.
The good news is that if you have a Grafana Cloud account, these two tools have also been installed in your account. If you have chosen the self-hosted option, you must install these tools (Docker images exist for these tools, here and here).
Now, tell DecaLog to send events to the right Loki instance by adding a logger: a “Grafana Cloud Events” logger if you go with Grafana Cloud or a “Loki” logger if you self-host it.
Note: for Grafana Cloud, you have to click on “Send Logs” button in your account to get the details of hosts and credentials.
Then, do the same thing to send traces by adding a “Grafana Cloud Traces” or “Tempo” logger according to your choice of environment.
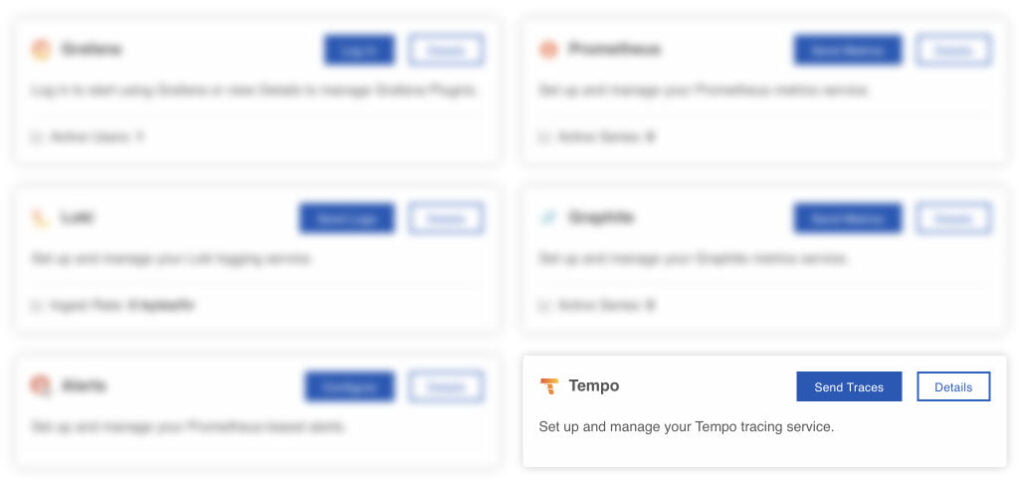
Note: for Grafana Cloud, you have to click on “Send Traces” button in your account to get the details of hosts and credentials.
Associating events and traces
Now you have done this, WordPress events and traces are correctly sent, and are available in Grafana. Nevertheless, even if the events are easily visualized – via the “explore” menu of Grafana – the traces are more difficult to find? for the moment.
You can indeed link events and corresponding traces. To allow such navigation from events to traces, go to in Data Sources / Loki (in Grafana) and add the following derived field:
Thanks to Grafana, Loki and Tempo, you’re now able to access all your WordPress events and traces uniformly and efficiently. Let’s see now how to collect and display metrics collated by DecaLog.
If you have question about WordPress observability with DecaLog, you can reach me on Twitter.


